A World Map is a map of a country, a continent, or a region, with colors and values assigned to specific regions. Values are displayed as a color scale, and you can see the name of the country by hovering over a particular part.

World Map
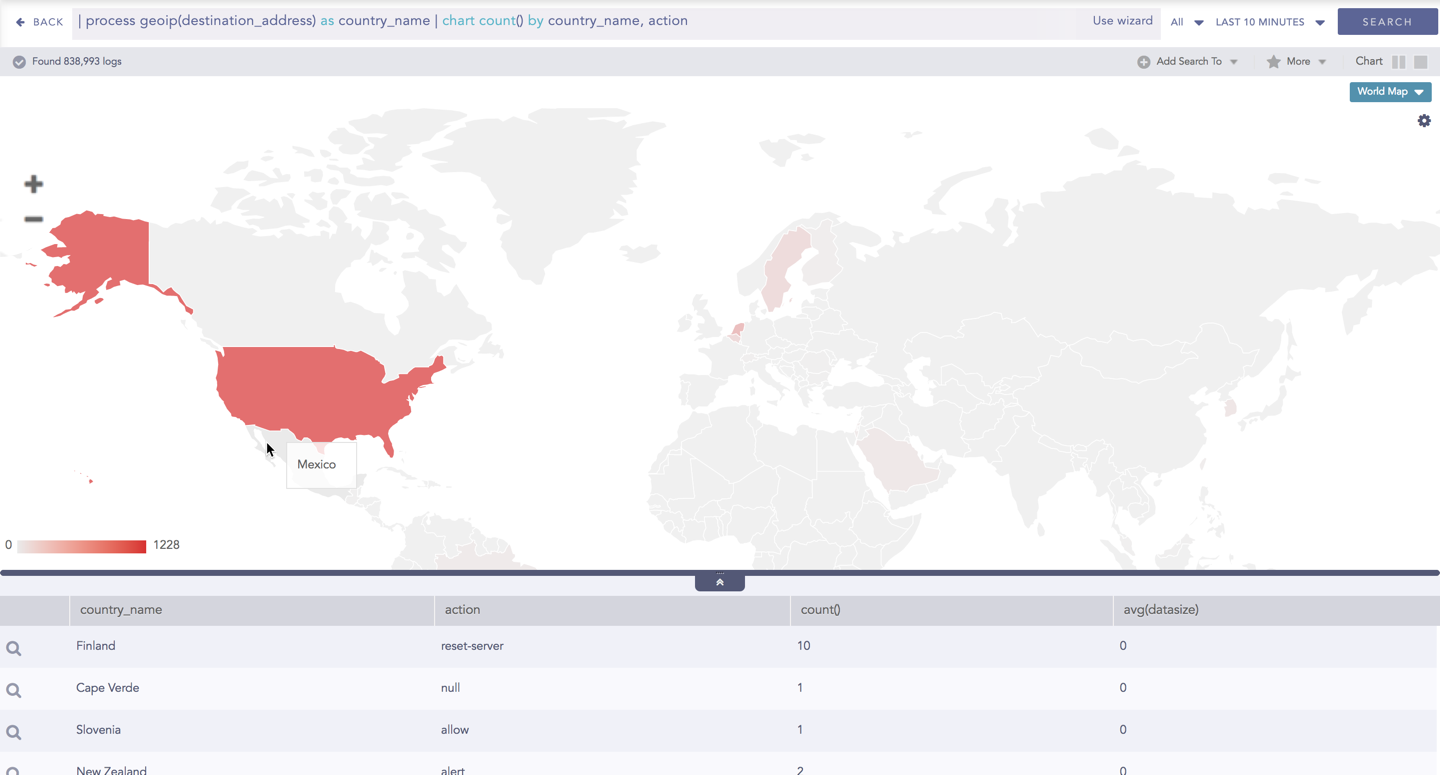
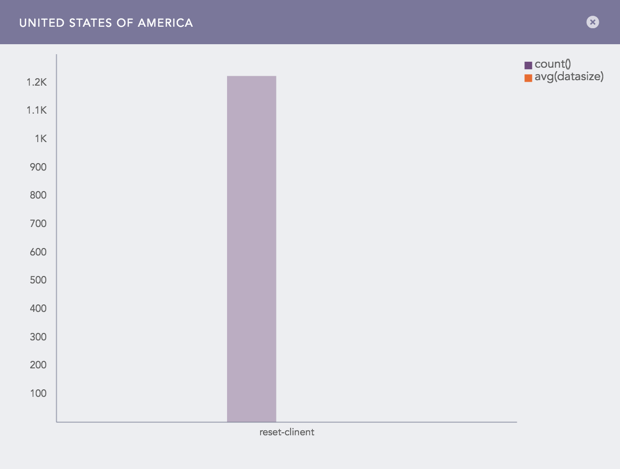
The following query gives the output shown above.
| process geoip(destination_address) as country_name | chart count(), avg(datasize) by country_name, action
The World Map chart supports two aggregation response types for representation of search results in the visualization. They are:
Response Type |
General Syntax |
|---|---|
| chart aggregation_parameter by grouping_parameter1, grouping_parameter2, ........, grouping_parametern
|
|
| chart aggregation_parameter1, aggregation_parameter2 by grouping_parameter1, grouping_parameter2, ..., grouping_parametern
|
In Single Aggregation with Grouping, the color shade on each region of a World Map displays the value of the aggregation parameter, i.e., higher the value of the aggregation parameter, darker the color.
Example:
| process geoip(destination_address) as country_name | chart count() by country_name, action
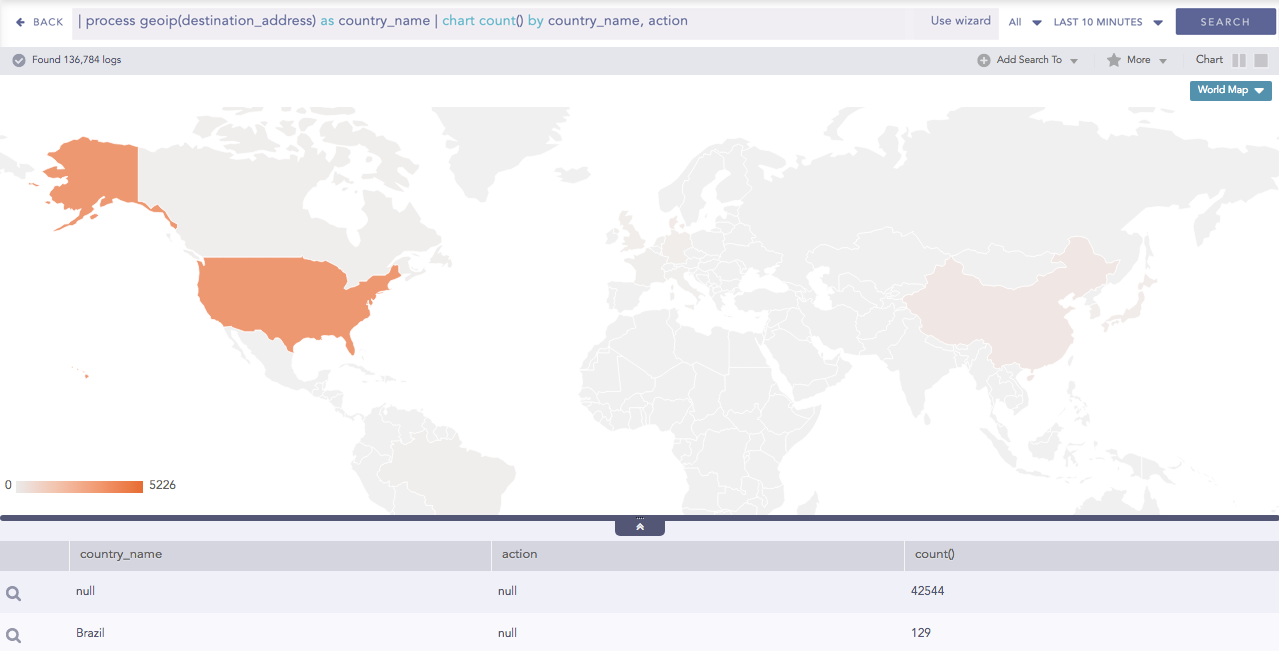
World Map for Single Aggregation with Grouping
Some notable points about the World Map:
Sections of a graph are only clickable if they have some value of aggregation parameter and the search query contains two or three grouping parameter meaning that you cannot click and further drill-down the chart for a query with one grouping parameter or more than three grouping parameters.
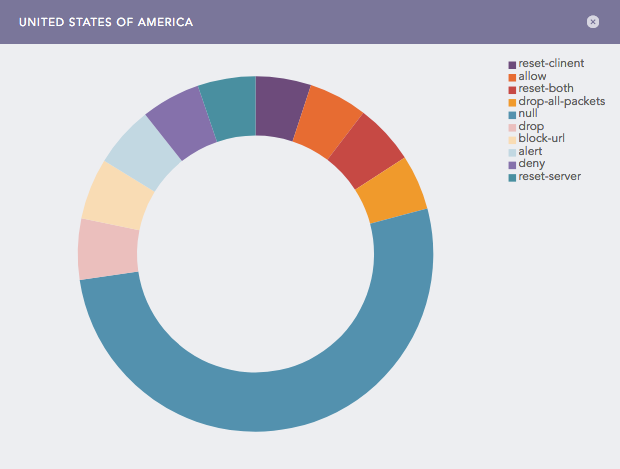
For search queries with a single aggregation parameter and two grouping parameters, you can view a Donut chart by clicking on any region of a World Map (with some value for the aggregation parameter).
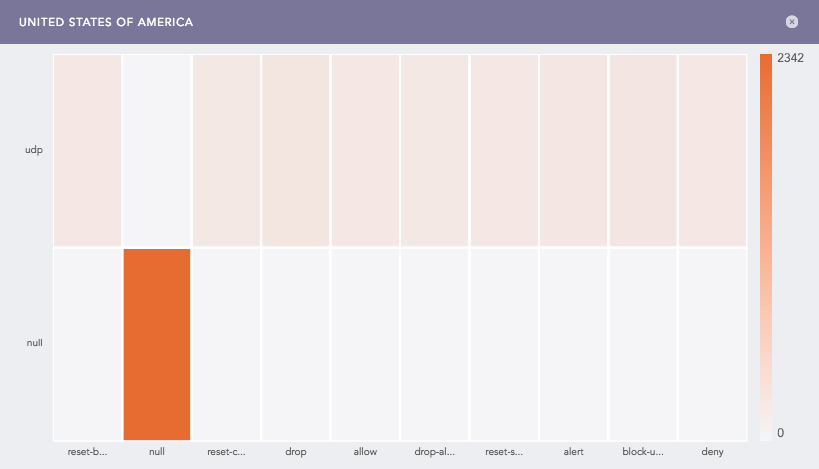
For search queries with a Single aggregation parameter and three grouping parameters, you can view a Heatmap by clicking on any region of a World Map(with some value for the aggregation parameter).
Note
You can drill-down operations from these sub-charts.
You can refer to Single Aggregation with Grouping for more details.
In Multiple Aggregation with Grouping, the color shade on each region of a World Map displays the value of the first aggregation parameter, i.e., higher the value of the aggregation parameter, darker the color. The values of all other successive aggregation parameters can be viewed using the sub-charts.
Example:
| process geoip(destination_address) as country_name | chart count(), avg(datasize) by country_name, action

World Map for Multiple Aggregation with Grouping
Note
The value of the first grouping parameter can only be depicted in the chart if the search query contains only one grouping parameter. However, the value can be viewed from the Search Table.
Sections of a graph are only clickable if they have some value of aggregation parameter and the search query contains two or three grouping parameters. Thus, you cannot click and further drill-down the chart for a query with one grouping parameter or more than three grouping parameters.
For search queries with multiple aggregation parameters and two or three grouping parameters, you can view a Clustered Column chart by clicking on any region of a World Map (with some value for the aggregation parameter).
Note
You can further drill down from these charts.
You can refer to Multiple Aggregation with Grouping for more details.
Click the gear icon at the top right corner of the World Map to open the rendering parameters panel.
The Rendering Parameters such as Country, Positive Value, and Negative Value provide a custom settings option to view data in different formats.
Through the Country option, you can specify the grouping parameter containing the names of the countries. Whereas, the Positive Value and Negative Value options allow you to select the color to represent the positive values of the aggregation parameter and the negative value of the aggregation parameter respectively.
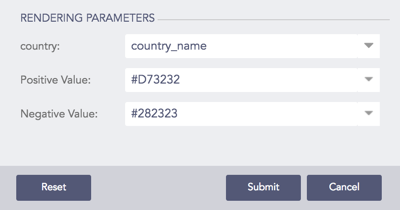
Rendering Parameters